

Table of Contents
- Quick Comparison
- What Is an AI Infographic Generator?
- Why Use an AI Infographic Generator?
- 1. Piktochart
- 2. Canva
- 3. Visme
- 4. Venngage
- 5. Infogram
- 6. Napkin AI
- 7. Adobe Express
- 8. Appy Pie Design
- 9. DesignCap
- 10. ChatGPT Plus a Design Tool
- How to Choose the Best AI Infographic Generator
- Prompt Examples for AI Infographics
- Common Mistakes to Avoid
- FAQ
- Final Thoughts
Quick Comparison
| Tool | Best For | Key Strength | Good Fit |
|---|---|---|---|
| Piktochart | Business reports and explainers | Fast text-to-visual workflow | Marketers, educators, teams |
| Canva | Social and marketing infographics | Templates, brand kits, easy editing | Beginners, creators, small teams |
| Visme | Presentations and visual reports | Rich charts and business assets | Teams, trainers, analysts |
| Venngage | Professional infographic templates | Strong structured layouts | HR, education, marketing |
| Infogram | Data-heavy charts and dashboards | Interactive data visualization | Analysts, publishers, researchers |
| Napkin AI | Turning written ideas into visuals | Quick concept-to-diagram conversion | Writers, founders, consultants |
| Adobe Express | Polished branded graphics | Fast design generation and editing | Creators, marketers, brand teams |
| Appy Pie Design | Simple prompt-based design | Beginner-friendly AI generation | Non-designers, small businesses |
| DesignCap | Quick template editing | Lightweight infographic creation | Students, bloggers, casual users |
| ChatGPT plus a design tool | Planning infographic structure | Strong outline and copy support | Anyone who wants better content first |
What Is an AI Infographic Generator?
An AI infographic generator is a tool that helps turn plain text, research notes, statistics, or a prompt into a more visual layout. Instead of starting with a blank canvas, you can describe what you need and let the tool suggest charts, icons, sections, headlines, timelines, or summary blocks.
The best AI infographic generator does not simply make something pretty. It helps you organize information so readers can understand the point faster. That matters for blog posts, reports, presentations, classroom materials, product comparisons, social media posts, and internal business documents.
Some tools focus on design templates. Some are better at data visualization. Others are useful when you have a paragraph of messy notes and need a clean diagram or infographic outline. The right choice depends on whether your priority is speed, design control, data accuracy, or brand consistency.
Why Use an AI Infographic Generator?
A good infographic can make a dry topic easier to scan. But building one manually often takes time: choosing a layout, shortening text, creating sections, picking icons, matching colors, and checking whether the story still makes sense.
An AI infographic maker can speed up that process in a few practical ways:
- It can turn long notes into a structured visual outline.
- It can suggest sections, headings, icons, and chart types.
- It can help non-designers create cleaner layouts.
- It can repurpose blog posts, reports, and presentations into visuals.
- It can create quick drafts before a designer polishes the final version.
For SEO content, an AI infographic generator is especially useful because visual summaries can make articles more shareable and easier to read. A well-made infographic can also support Pinterest posts, LinkedIn carousels, newsletters, and downloadable resources.
1. Piktochart
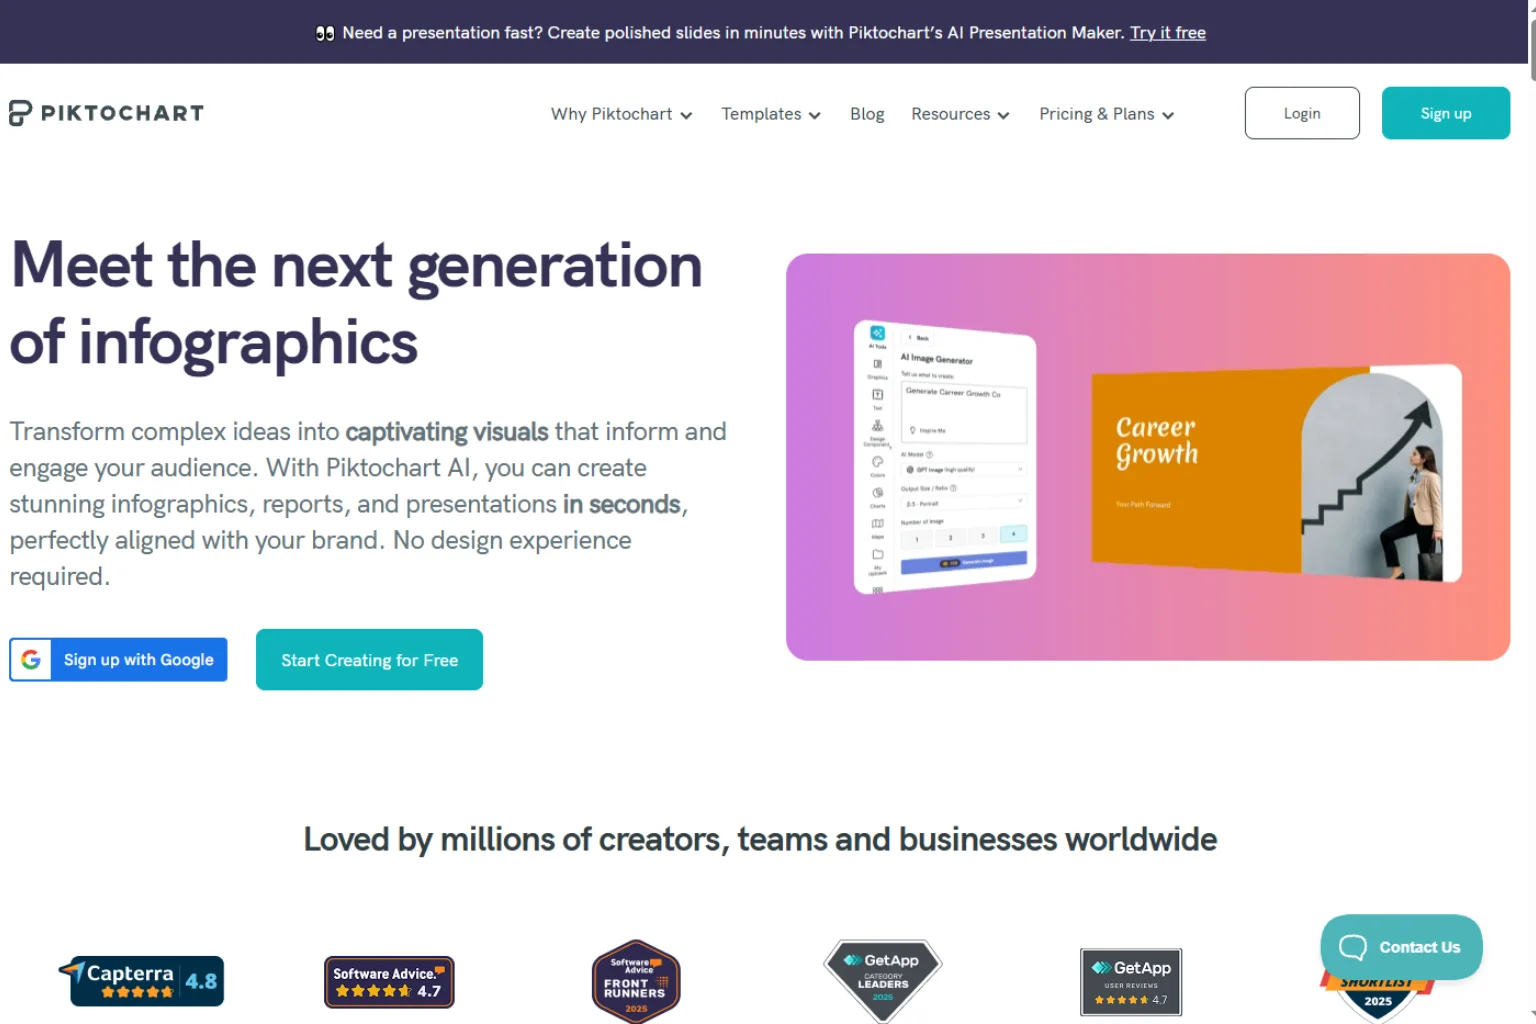
Piktochart is one of the stronger options for people who want to create business-friendly infographics without spending hours on layout. It works well for reports, educational explainers, marketing visuals, process summaries, and comparison graphics.
Its biggest advantage is that it feels made for information design, not just general graphic design. You can start from a template, customize sections, adjust colors, add icons, and turn text into a more organized visual. For users searching for an AI infographic generator that can handle reports and professional content, Piktochart is a reliable first pick.
Piktochart is a good fit if you need:
- Report infographics
- Blog summary graphics
- HR or training visuals
- Educational explainers
- Business one-pagers
The editing experience is approachable, so it works well for marketers, teachers, students, consultants, and small teams. If your infographic has lots of text, you should still spend time trimming copy. AI can suggest a layout, but short, clear writing is what makes the design readable.
2. Canva
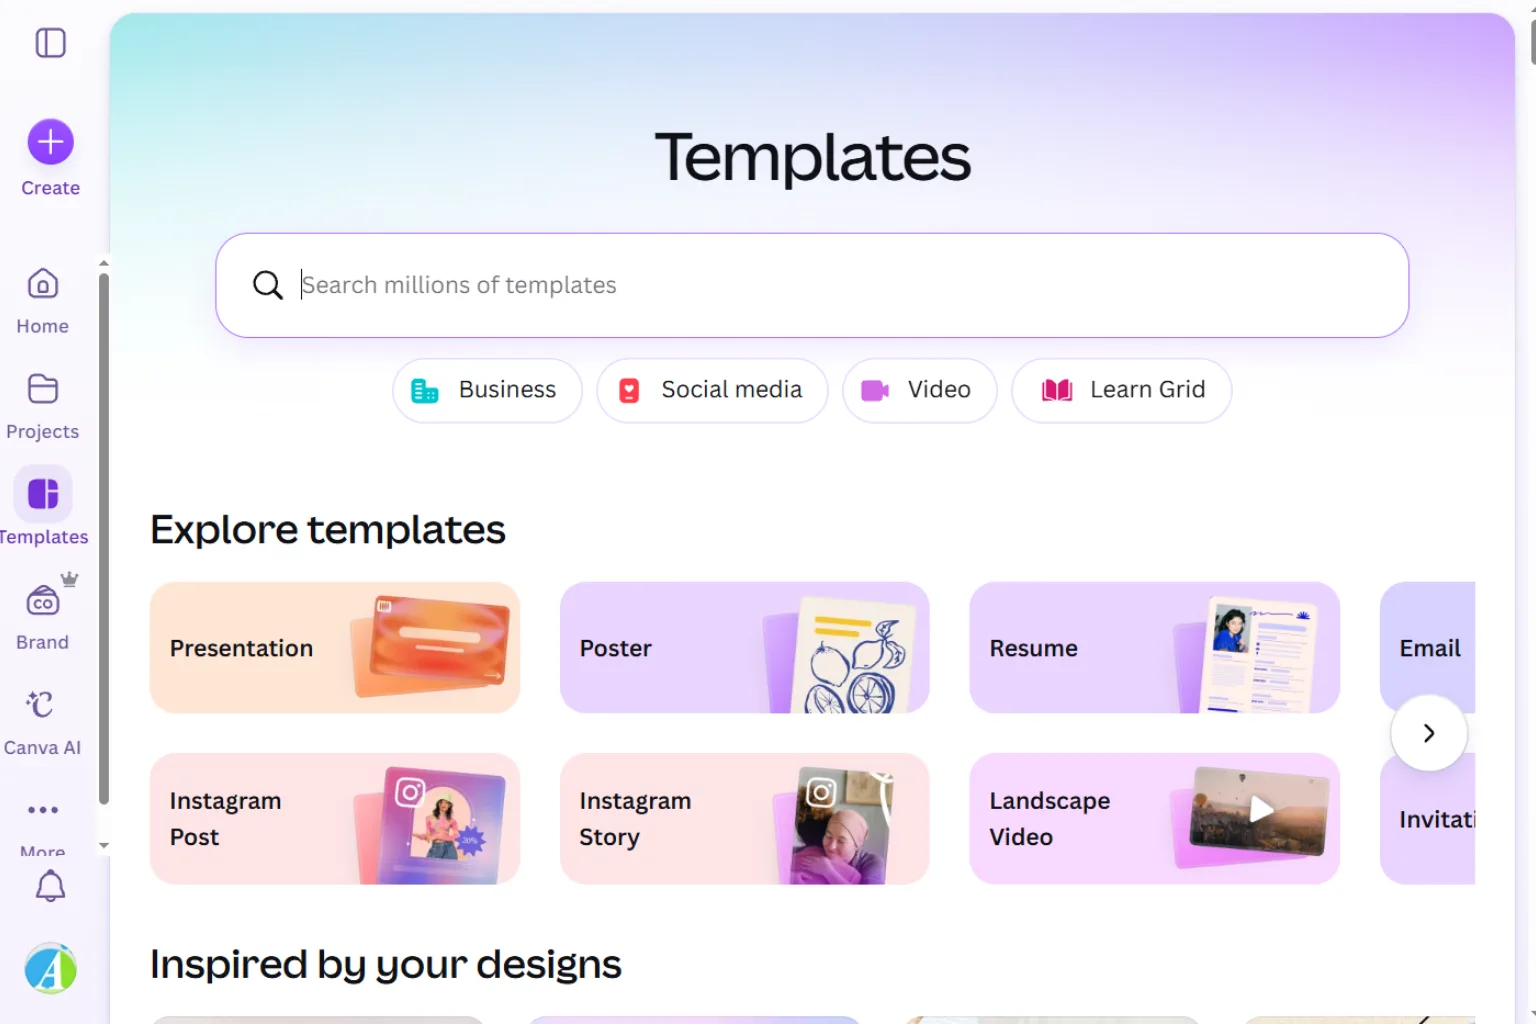
Canva is a popular choice for anyone who wants an AI infographic maker with a large template library and easy editing tools. It is especially useful for social media graphics, blog visuals, list-style infographics, checklists, and promotional content.
The main advantage of Canva is speed. You can start with a template, use AI features to generate copy or design ideas, add icons, apply brand colors, and export a polished visual quickly. For creators and small businesses, that is often enough.
Canva is best when the infographic needs to look clean and shareable, but does not require complex data handling. It is a practical choice for:
- Social media infographics
- Simple educational visuals
- Marketing checklists
- Blog post graphics
- Brand-friendly content upgrades
If you need deep chart control or interactive data, other tools may be stronger. But for fast visual content, Canva remains one of the easiest AI infographic generator options to recommend.
3. Visme
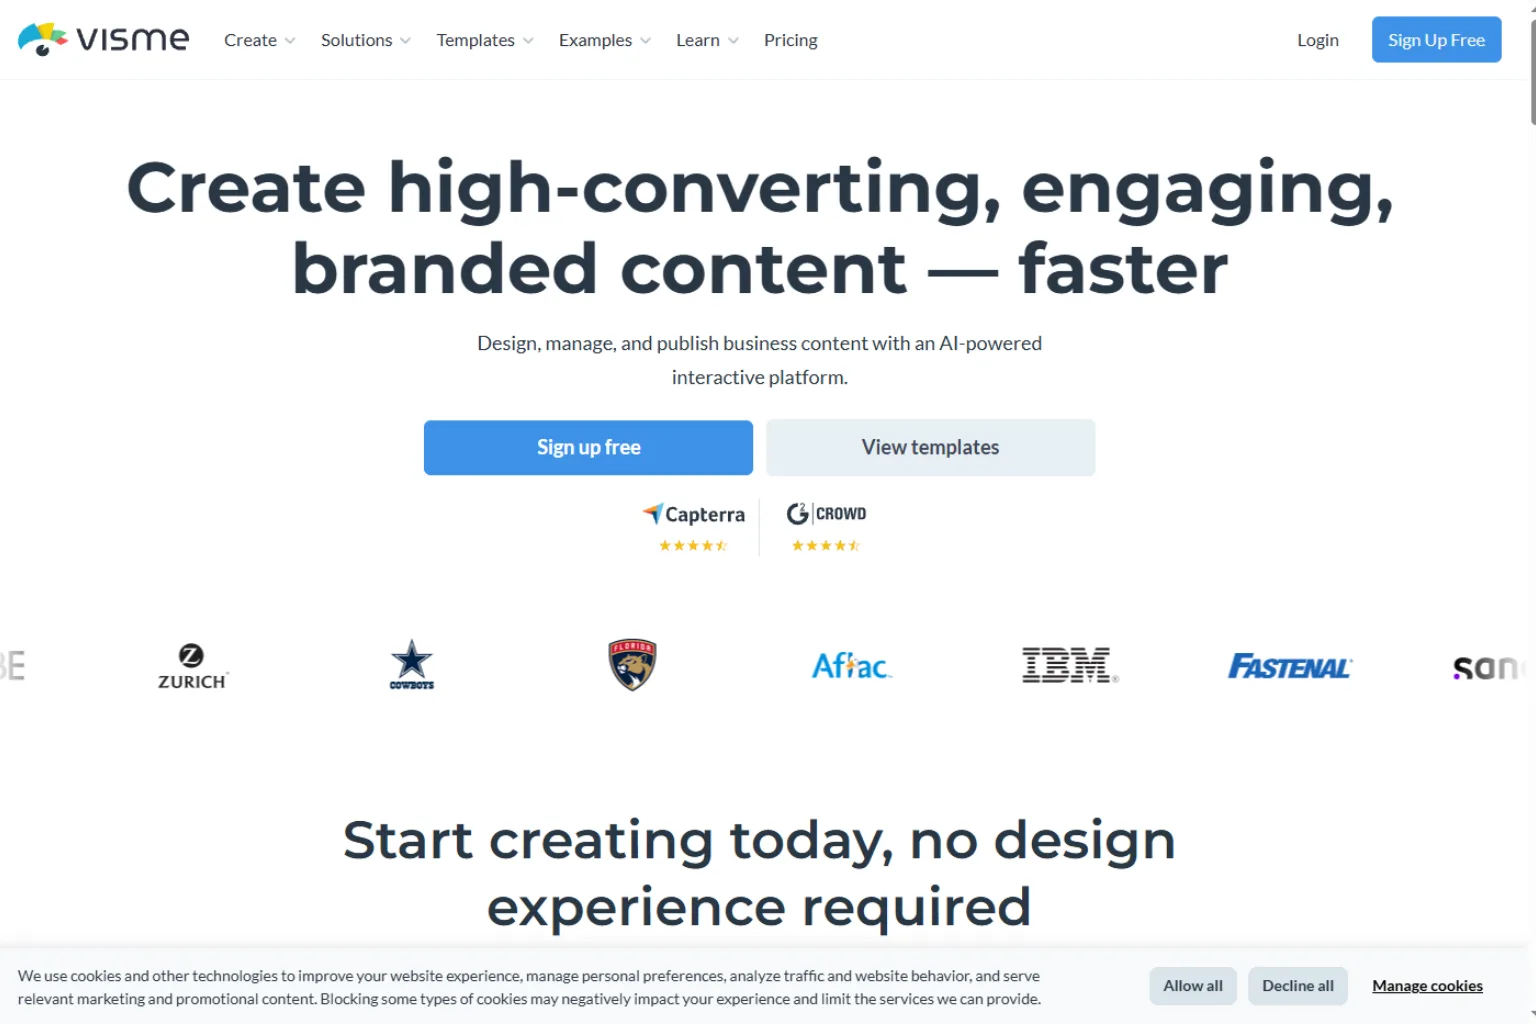
Visme is a strong option for users who want infographics, presentations, charts, reports, and branded visual assets in one place. It sits between a simple template editor and a more business-focused visual communication platform.
Visme is useful when your infographic is part of a bigger content package. For example, you might create a slide deck, a report, a data chart, and a downloadable infographic using the same visual style. That makes it helpful for teams that care about consistency.
You may like Visme if you need:
- Presentation infographics
- Data charts
- Visual reports
- Training materials
- Brand-controlled templates
As an AI infographic tool, Visme is best for people who want more control than a basic design app but still want a friendly workflow. It is a good choice for marketers, educators, business teams, and consultants.
4. Venngage
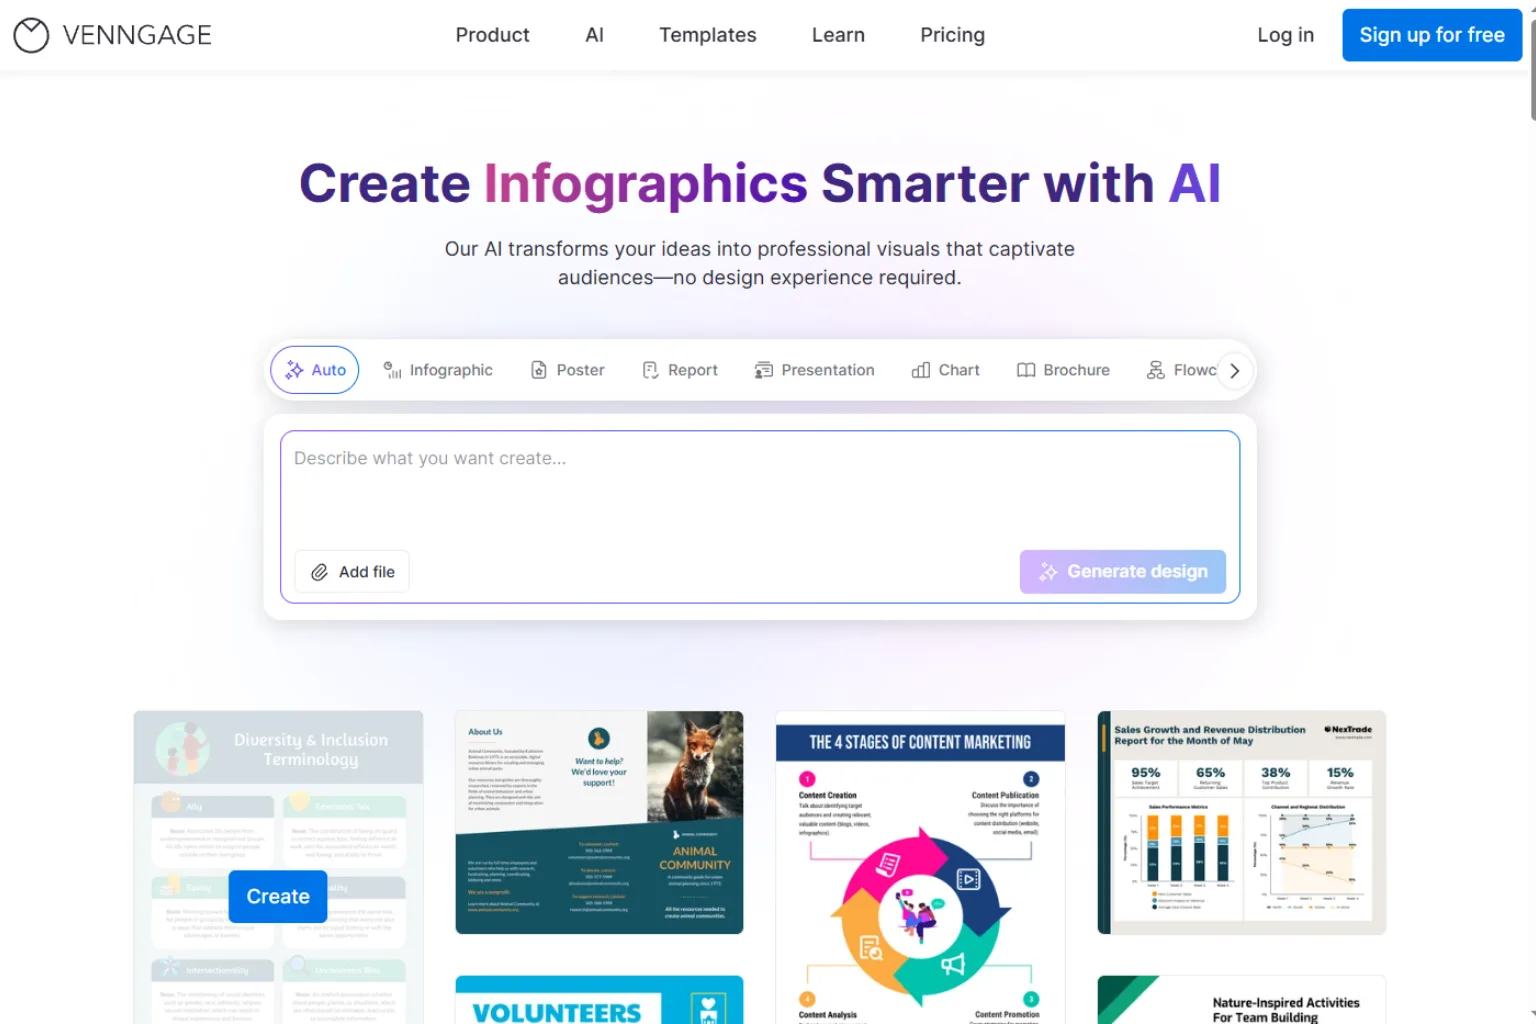
Venngage is known for structured infographic templates. It is a good AI infographic generator candidate for users who care about clear layout more than experimental design.
The tool works well for step-by-step explainers, process graphics, timelines, comparison charts, nonprofit reports, classroom materials, and HR documents. Its template-first approach is helpful because many infographics fail not because the colors are wrong, but because the hierarchy is weak. Venngage gives you a cleaner starting point.
Venngage is especially useful for:
- Process infographics
- Timelines
- Comparison layouts
- Training graphics
- Simple report visuals
If you are making a formal business infographic, Venngage can help you avoid a messy, overdecorated design. It is less about flashy AI effects and more about building a readable piece of communication.
5. Infogram
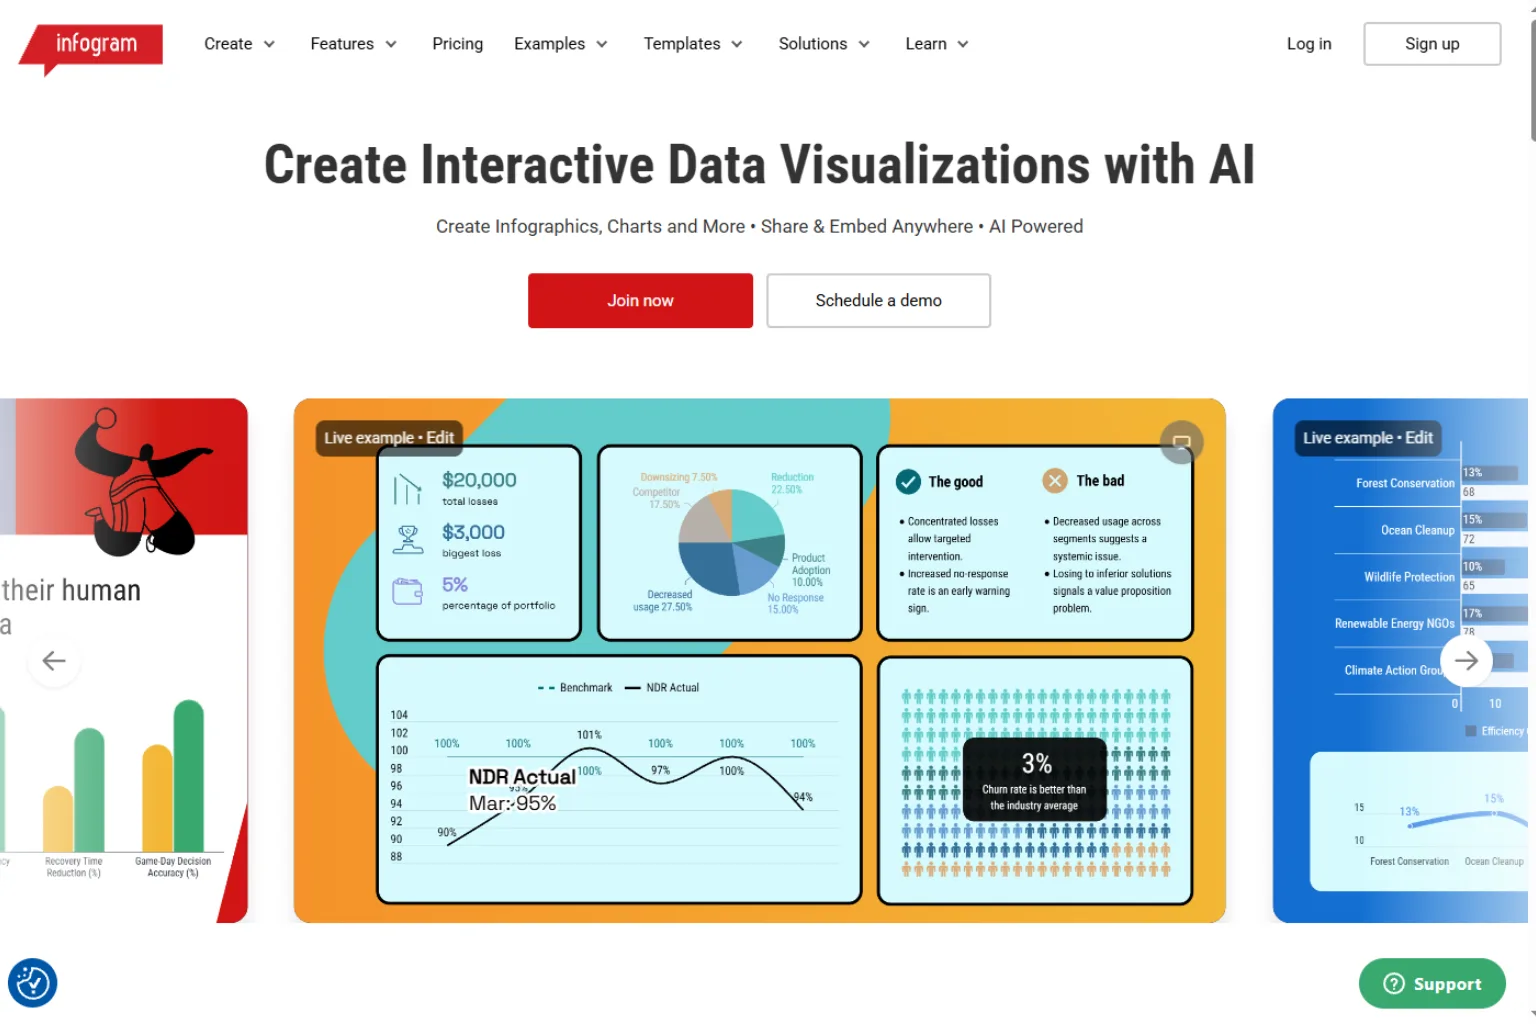
Infogram is a better fit when your infographic depends on data. If you need charts, maps, interactive visuals, or data-driven stories, it can be more useful than a general design tool.
Many AI infographic maker tools can produce attractive layouts, but not all of them handle data well. Infogram is worth considering if your content includes survey results, statistics, rankings, research findings, or business metrics.
Use Infogram for:
- Data visualization
- Charts and graphs
- Interactive reports
- Statistics-based articles
- Research summaries
It may not be the fastest option for a simple social media graphic, but it is stronger for accuracy and structured data presentation. If your target keyword is close to AI data visualization generator or AI chart generator, Infogram belongs on the shortlist.
6. Napkin AI
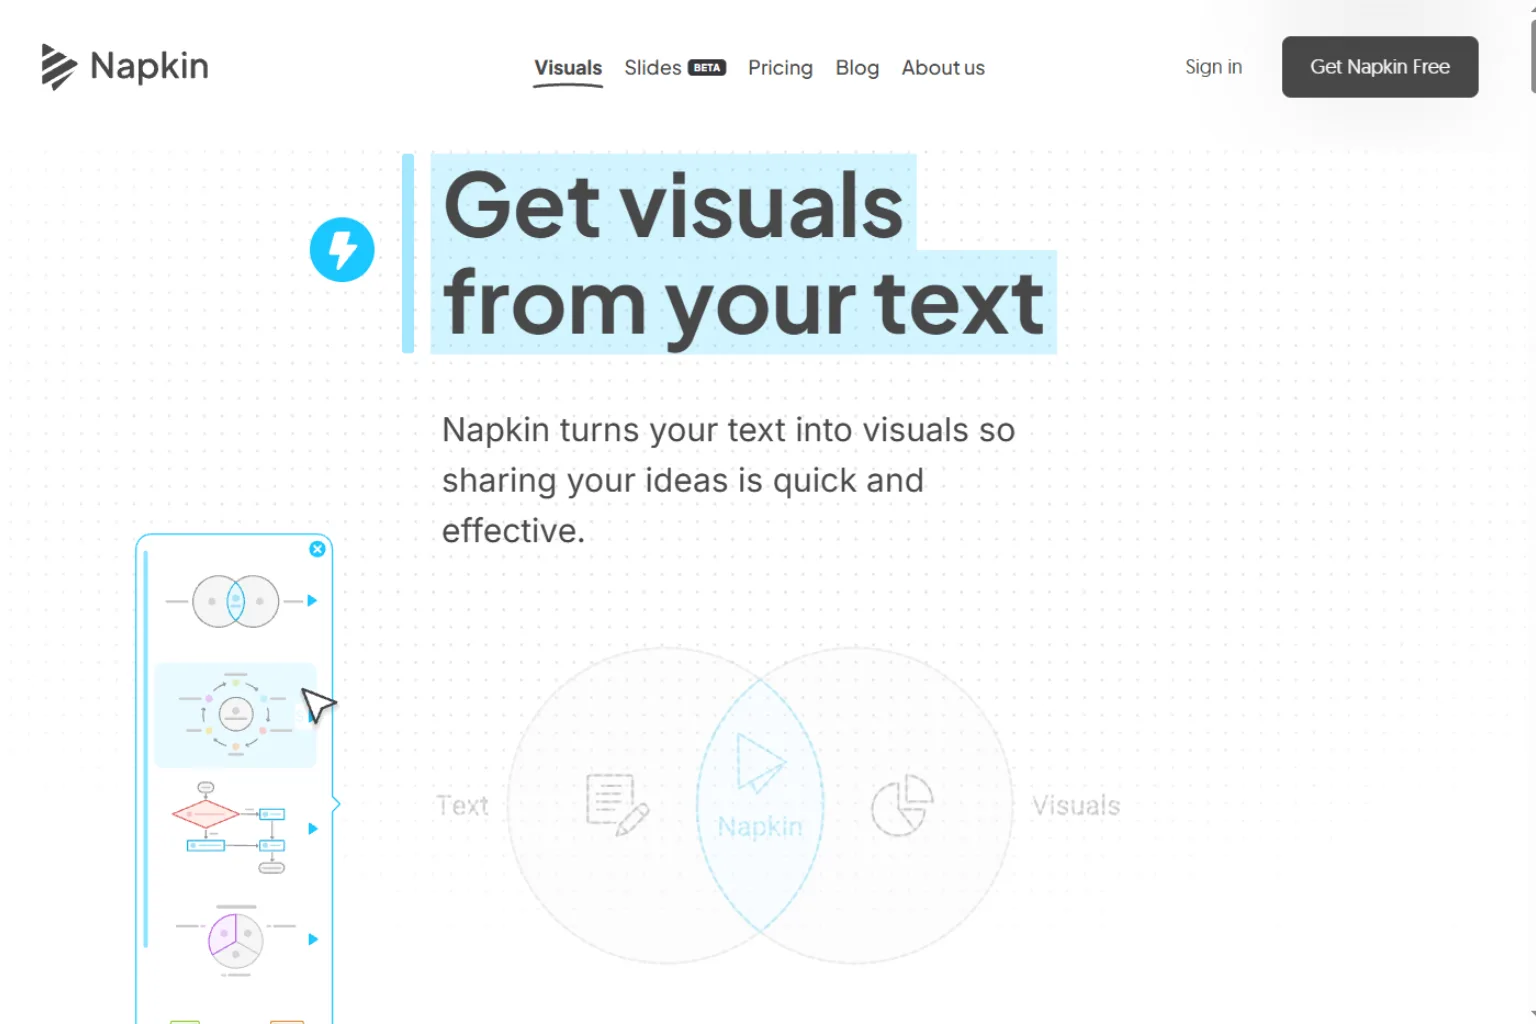
Napkin AI is useful when you have written ideas and want to turn them into visual diagrams or simple infographic-style concepts. It is less about traditional template editing and more about making text easier to explain visually.
For writers, founders, consultants, and educators, this can be very helpful. You can take a paragraph, framework, process, or argument and turn it into a visual structure. That makes Napkin AI a strong companion for blog posts, presentations, strategy documents, and learning materials.
Napkin AI is a good fit for:
- Turning notes into visuals
- Creating concept diagrams
- Explaining frameworks
- Making quick presentation graphics
- Visualizing blog post ideas
If you want a full, polished infographic poster, you may still want to finish the design in another tool. But for the thinking stage, Napkin AI can save a lot of time.
7. Adobe Express
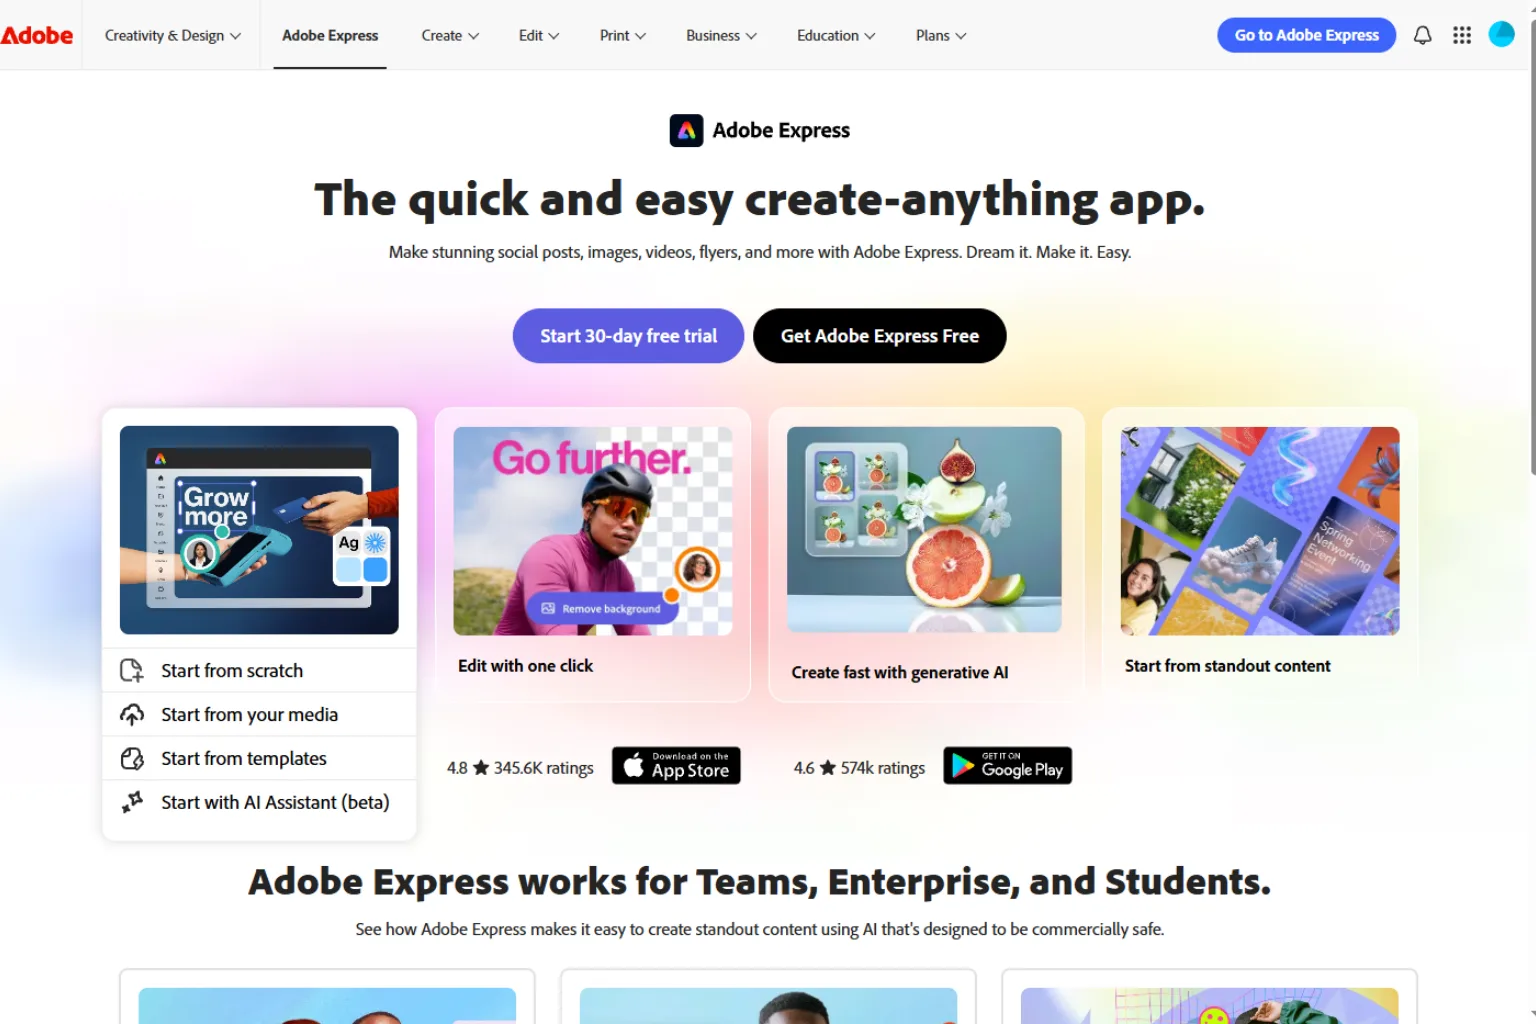
Adobe Express is a good choice for users who want quick design generation with a polished, brand-friendly feel. It works well for posters, social graphics, simple infographics, marketing visuals, and content repurposing.
The biggest reason to consider Adobe Express is its balance of ease and polish. You can create a visual quickly, then refine fonts, colors, images, and layout. It is useful for creators who want an AI infographic generator that feels lightweight but still professional.
Adobe Express is helpful for:
- Marketing infographics
- Social media explainers
- Branded visuals
- Quick campaign graphics
- Repurposed blog content
It is not always the deepest data visualization tool, but it is a strong option for fast creative work.
8. Appy Pie Design
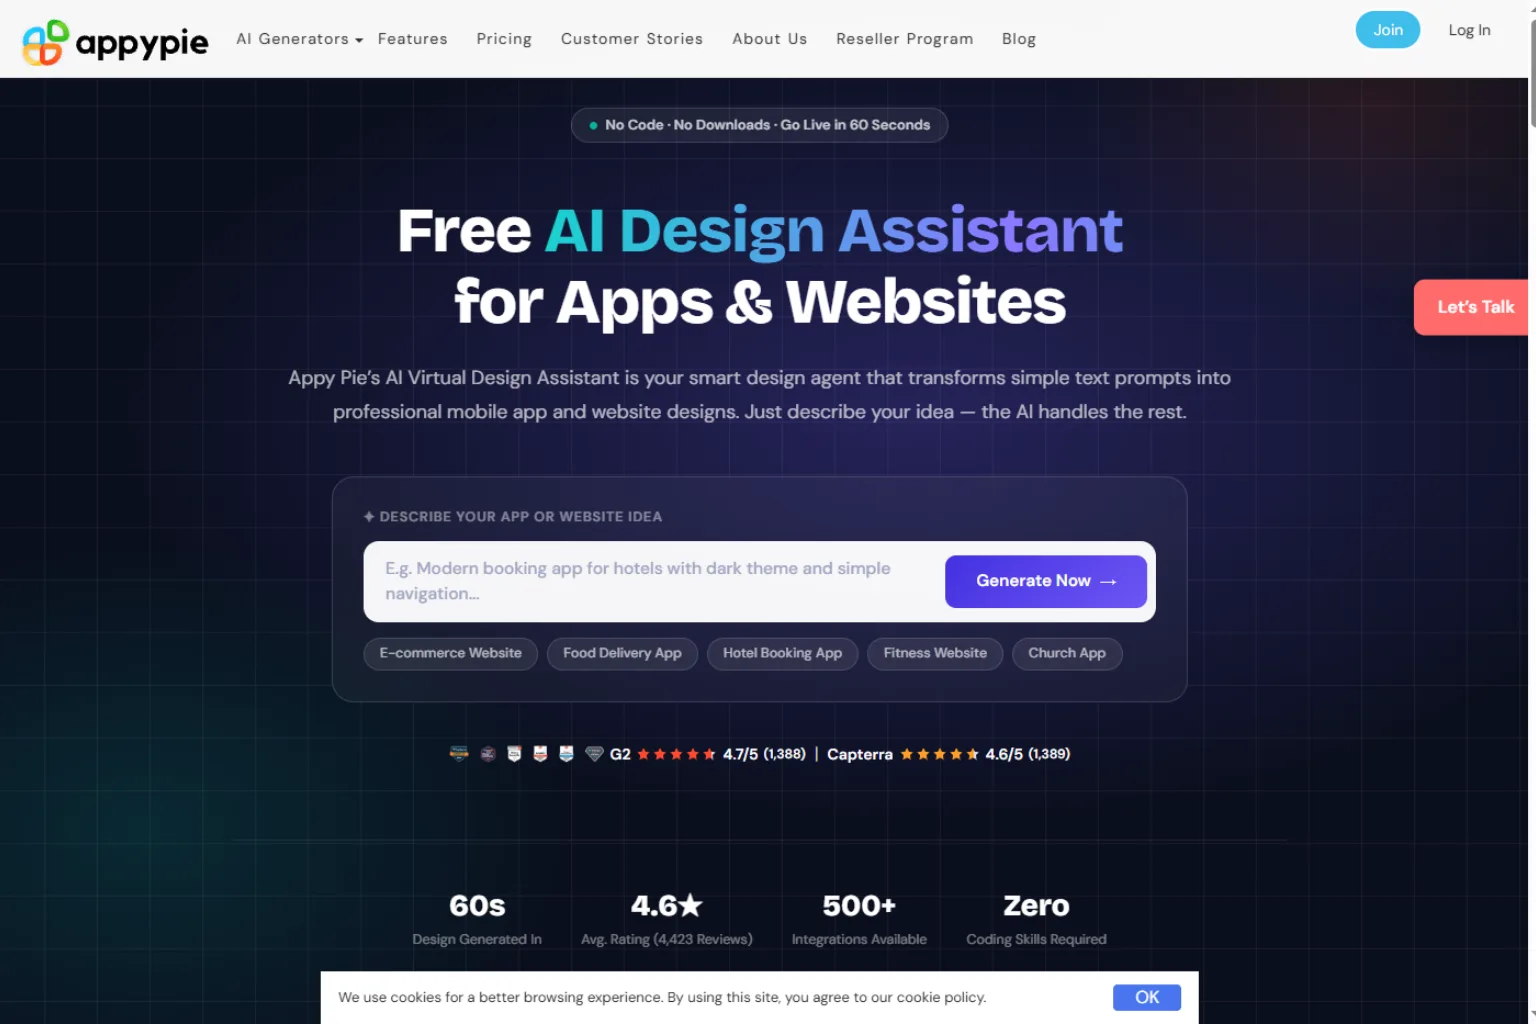
Appy Pie Design is a beginner-friendly option for users who want to generate simple graphics from prompts. It can help small businesses, bloggers, students, and non-designers create quick visual drafts without learning complex design software.
As an AI infographic maker, it is best for simple layouts rather than heavy data storytelling. You can use it for list graphics, promotional visuals, educational cards, and lightweight explainers.
Appy Pie Design is useful when you need:
- Simple prompt-based graphics
- Quick infographic drafts
- Small business visuals
- Beginner-friendly editing
- Fast design ideas
If your team has strict branding or advanced chart requirements, you may want a more specialized tool. But for quick content creation, it can be a convenient starting point.
9. DesignCap
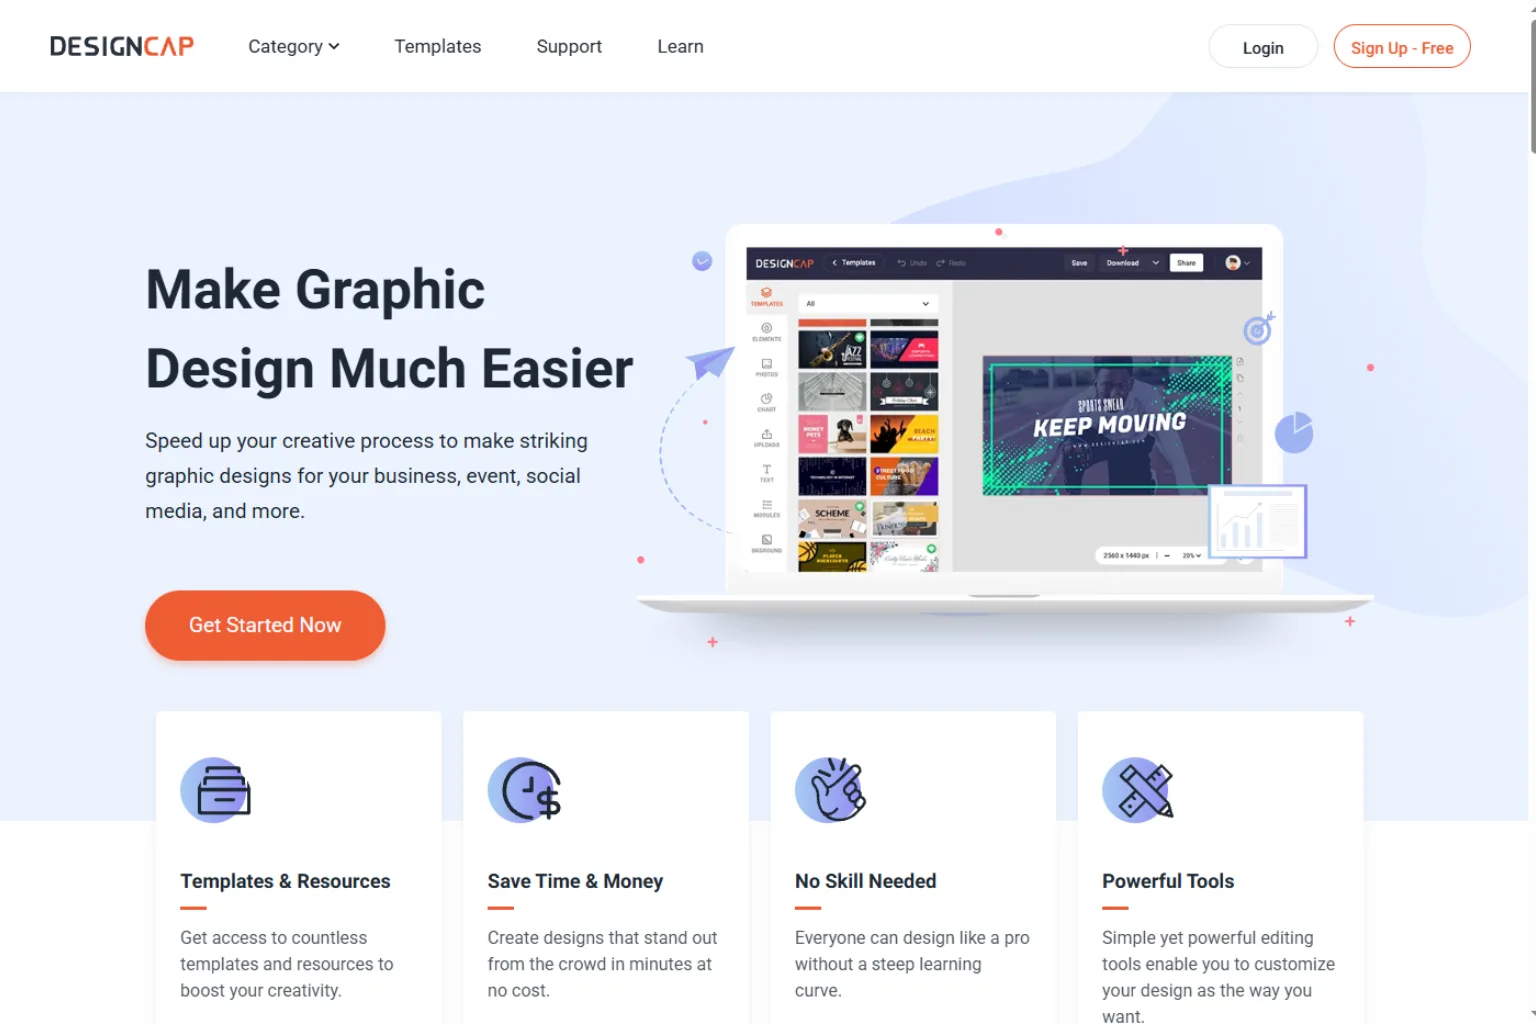
DesignCap is a lightweight design tool with templates for infographics, posters, flyers, and social graphics. It is a practical choice for users who want to create a simple infographic without a steep learning curve.
Its strength is not complex automation. Instead, it gives users a straightforward way to pick a layout, edit text, adjust colors, and export a clean visual. That can be enough for students, bloggers, and small businesses.
DesignCap is best for:
- Basic infographics
- Classroom visuals
- Blog images
- Simple list graphics
- Quick template editing
If you are comparing free AI infographic generator options, DesignCap can be included as a simple alternative, especially for users who prefer template editing over advanced AI workflows.
10. ChatGPT Plus a Design Tool
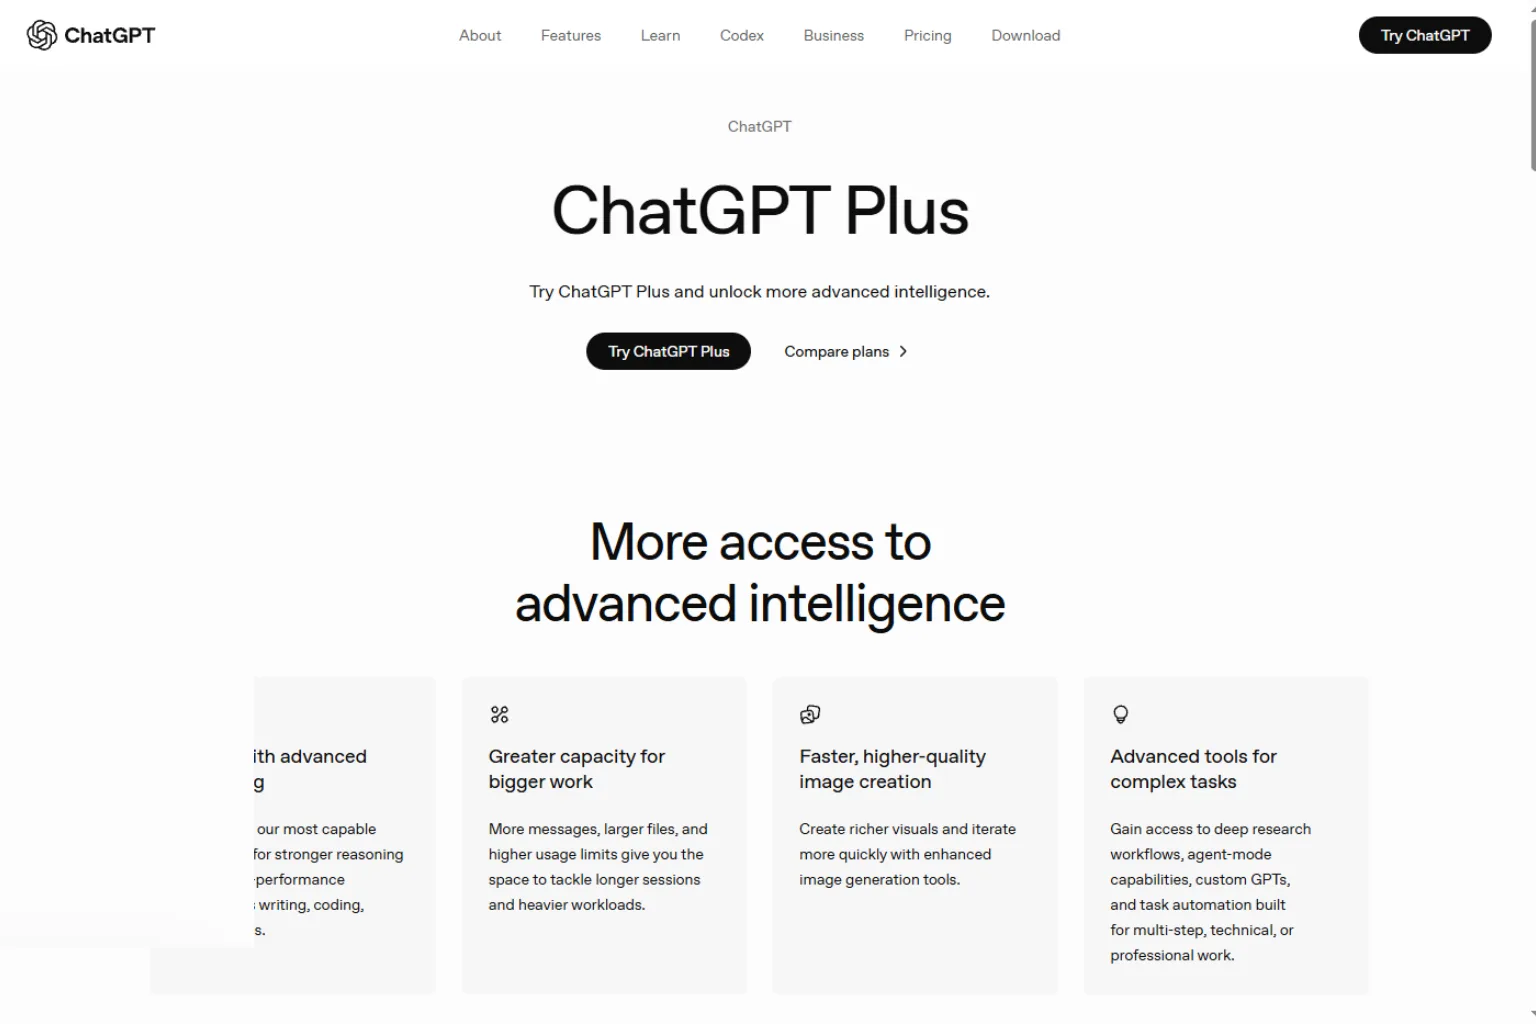
ChatGPT is not a full infographic design editor by itself, but it can be very useful before you open a design tool. You can use it to summarize research, structure a visual story, shorten headings, suggest chart types, and write cleaner labels.
This workflow is often underrated. Many weak infographics start with too much text and no clear message. ChatGPT can help you decide what to show, what to remove, and how to arrange the information.
A good workflow looks like this:
- Paste your rough notes.
- Ask for a 5-section infographic outline.
- Ask which chart type fits each section.
- Ask for short labels and a clear headline.
- Move the final structure into Canva, Piktochart, Visme, or another design tool.
For content teams, this combination can be more flexible than using one AI infographic generator alone.
How to Choose the Best AI Infographic Generator
The best AI infographic generator depends on what you are making. A student creating a class project does not need the same tool as a marketing team building branded campaign assets.
Use this simple guide:
| Need | Best Type of Tool |
|---|---|
| Fast social graphics | Canva, Adobe Express |
| Business reports | Piktochart, Visme |
| Data-heavy visuals | Infogram |
| Timelines and process graphics | Venngage, Piktochart |
| Visualizing written ideas | Napkin AI |
| Beginner-friendly templates | DesignCap, Appy Pie Design |
| Better infographic copy | ChatGPT plus a design tool |
You should also check whether the tool supports your export needs. For example, blog images may only need PNG or JPG. A presentation team may need PDF or PPT support. A brand team may need shared templates, brand colors, and team permissions.
Prompt Examples for AI Infographics
Here are a few prompt examples you can use with an AI infographic generator or a writing tool before designing:
Prompt for a blog infographic:
Create a 6-section infographic outline for an article about remote work productivity. Include a headline, short section titles, suggested icons, and one chart idea.
Prompt for a data infographic:
Turn these survey results into an infographic structure. Recommend the best chart type for each data point and write short labels under 8 words.
Prompt for a timeline infographic:
Create a timeline infographic about the history of AI writing tools. Use 7 milestones, one sentence per milestone, and a clean professional tone.
Prompt for a comparison infographic:
Create a comparison infographic between manual reporting and AI-assisted reporting. Include 5 comparison rows and a short conclusion.
Prompt for a student infographic:
Turn this research summary into a classroom infographic. Make it easy to understand for high school students and suggest visual sections.
Common Mistakes to Avoid
The biggest mistake is asking the AI infographic generator to include too much text. Infographics need short labels, clear numbers, and simple visual flow. If every section has a paragraph, the design becomes hard to read.
Another common problem is using charts without checking the data. AI can suggest chart types, but you should still verify numbers, labels, and scale. A chart that looks impressive but misrepresents data can hurt credibility.
Avoid these mistakes:
- Using tiny text that is hard to read on mobile
- Adding too many colors or icon styles
- Mixing unrelated chart types
- Forgetting the main takeaway
- Publishing AI-generated facts without checking them
- Using a template that does not match the content
Good infographic design is not about filling every inch. It is about making the important idea easier to understand.
FAQ
What is the best AI infographic generator?
Piktochart, Canva, Visme, Venngage, Infogram, and Napkin AI are all strong choices. The best option depends on whether you need templates, data visualization, business reports, or quick idea-to-visual conversion.
Is there a free AI infographic generator?
Many infographic tools offer free or freemium plans, though exports, templates, AI credits, or brand features may be limited. Free plans are usually enough for testing, but frequent publishing may require a paid plan.
Can AI create infographics from text?
Yes. Many AI infographic generators can turn text, prompts, notes, or outlines into visual drafts. You should still edit the copy, check the structure, and make sure the final design is readable.
Can I use AI infographic tools for blog posts?
Yes. They are useful for blog summaries, comparison charts, process graphics, timelines, and downloadable resources. For SEO content, a clean infographic can improve readability and encourage sharing.
Are AI-generated infographics accurate?
The design may look polished, but facts and numbers still need human review. Always check statistics, citations, dates, and chart labels before publishing.
Final Thoughts
The best AI infographic generator is the one that fits your content workflow. If you need fast social visuals, Canva or Adobe Express may be enough. If you need business reports, Piktochart or Visme are stronger. If your content depends on data, Infogram is worth testing. If you are still shaping the idea, Napkin AI or ChatGPT can help before you start designing.
For most users, the smartest workflow is simple: use AI to organize the idea, use a design tool to polish the layout, and do a final human check before publishing. That gives you speed without sacrificing clarity.
Related
Best AI Manga Translation Tools for Manga and Webtoons

Best AI Research Paper Summarizers for Students and Researchers

How to Use Claude Code (Beginner Guide)
6 Best AI Rewriter Tools in 2026 for Clearer, More Natural Content
Best Alternatives to OpenClaw
Best AI Tattoo Generators to Create Custom Tattoo Design Ideas